Example#
import matplotlib.pyplot as plt
from matplotlib_sankey import sankey, from_matrix
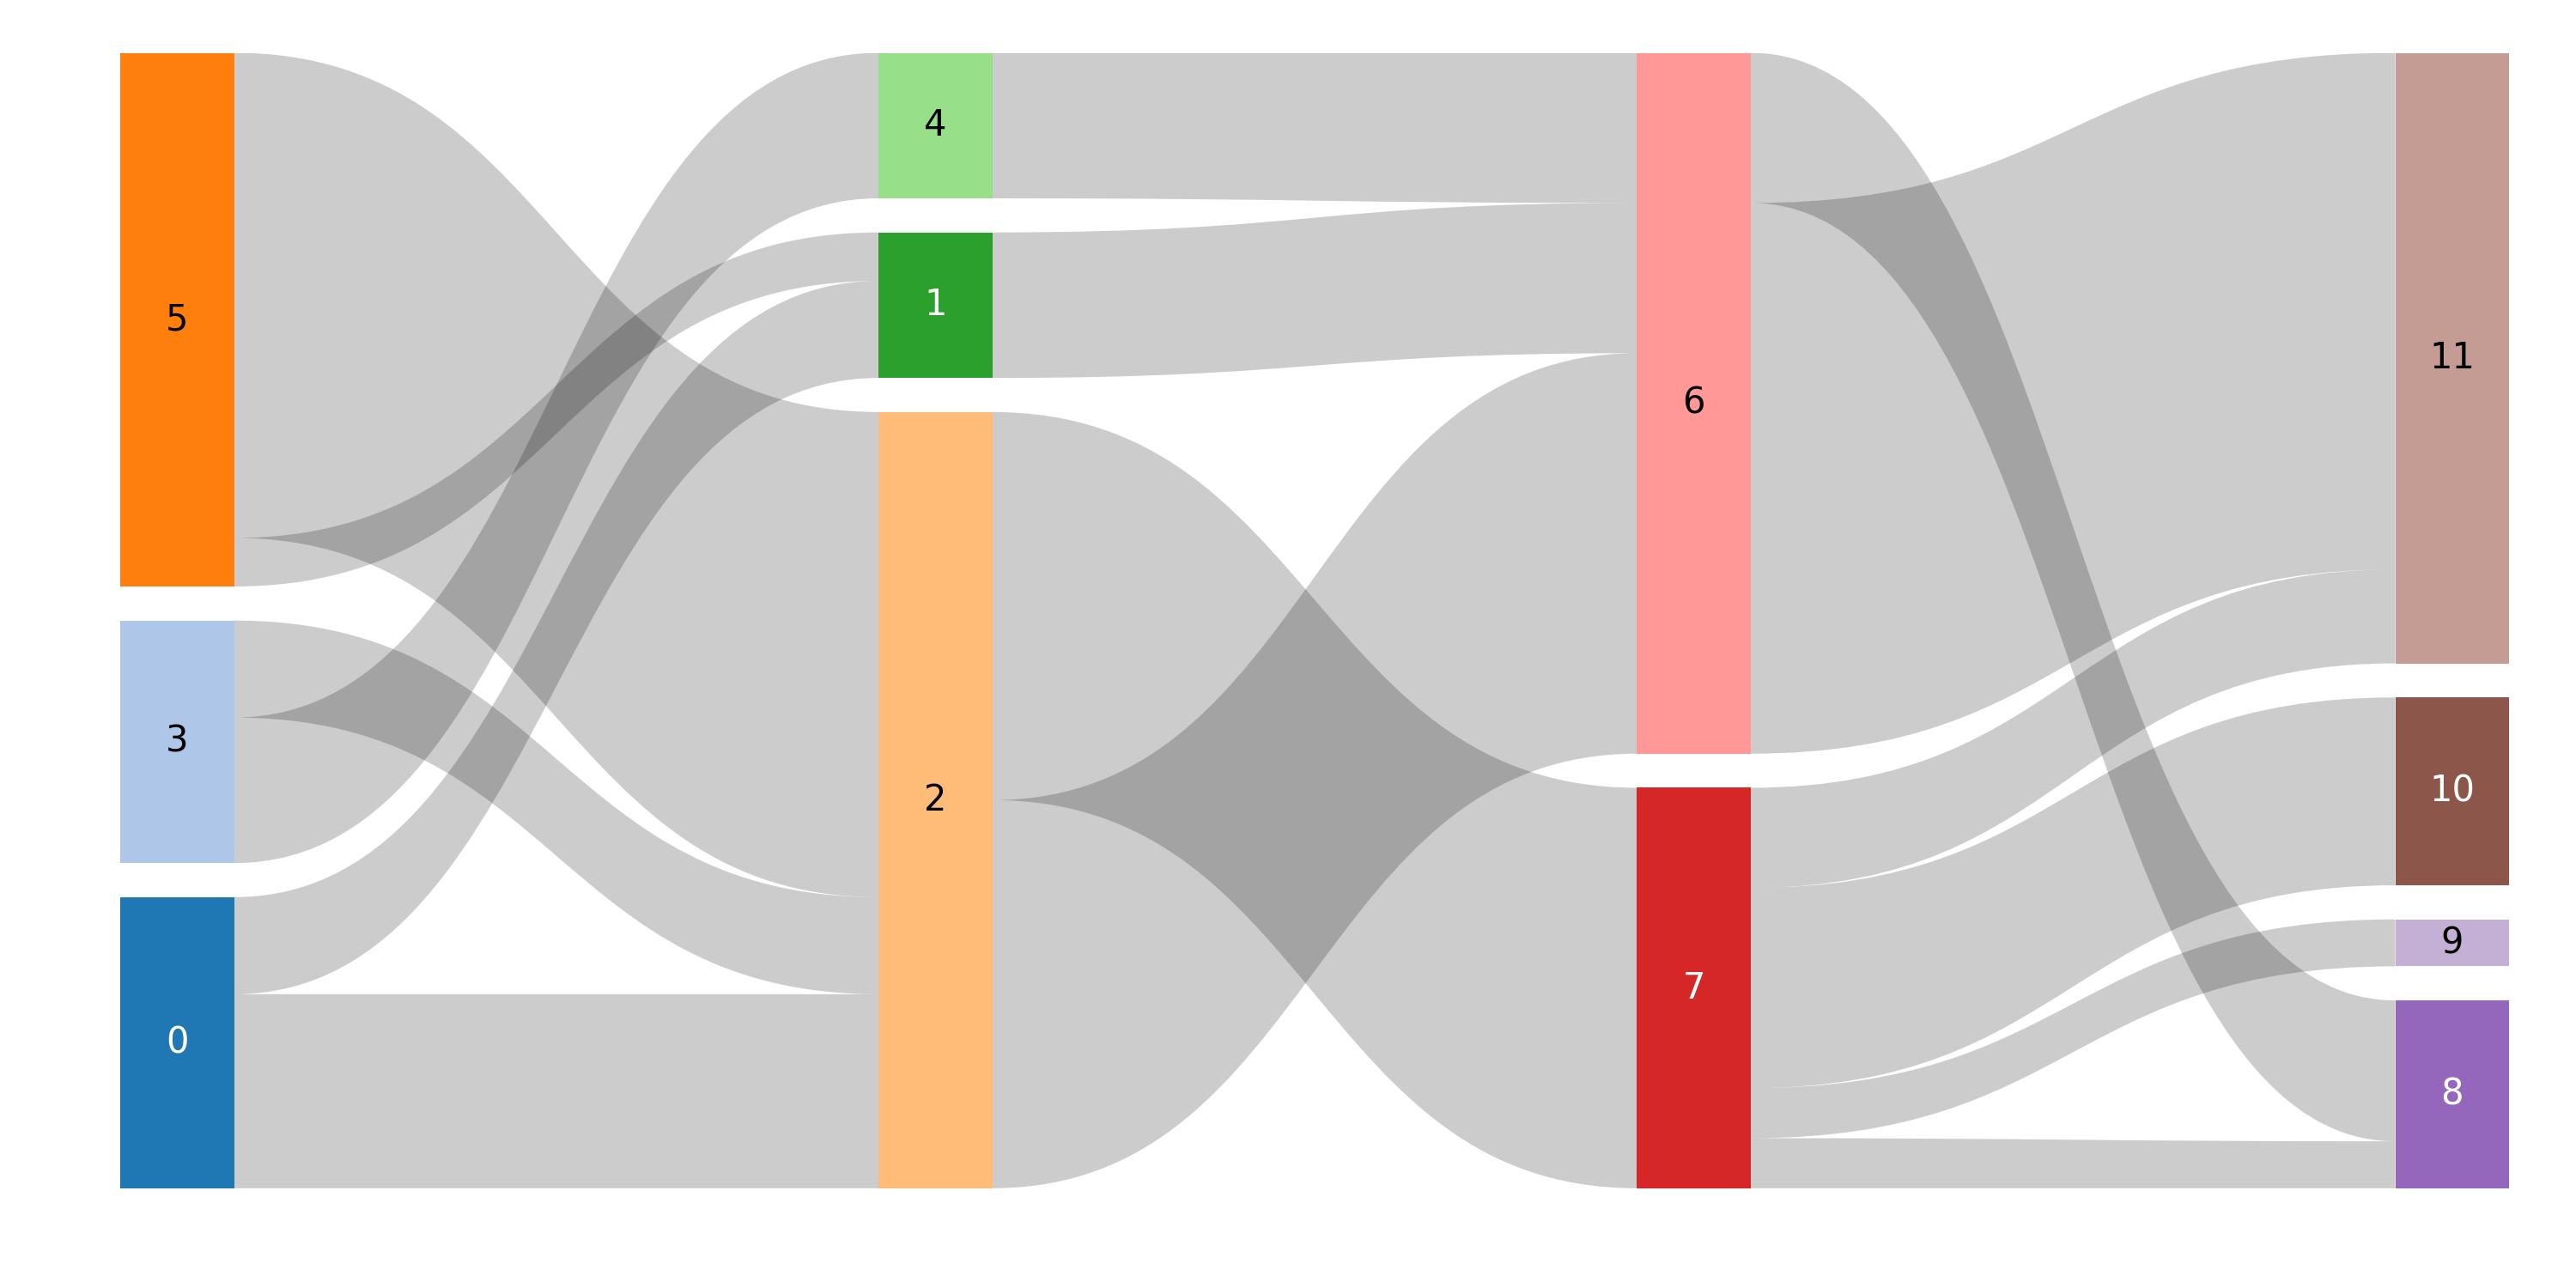
data = [
[(0, 2, 20), (0, 1, 10), (3, 4, 15), (3, 2, 10), (5, 1, 5), (5, 2, 50)],
[(2, 6, 40), (1, 6, 15), (2, 7, 40), (4, 6, 15)],
[(7, 8, 5), (7, 9, 5), (7, 10, 20), (7, 11, 10), (6, 11, 55), (6, 8, 15)],
]
fig, ax = plt.subplots(figsize=(10, 5))
fig.tight_layout()
sankey(
data=data,
cmap="tab20",
annotate_columns=True,
ax=ax,
spacing=0.03,
)